- 分析
- 技术分析
白銀对歐元 技术分析 - 白銀对歐元 交易: 2021-10-15
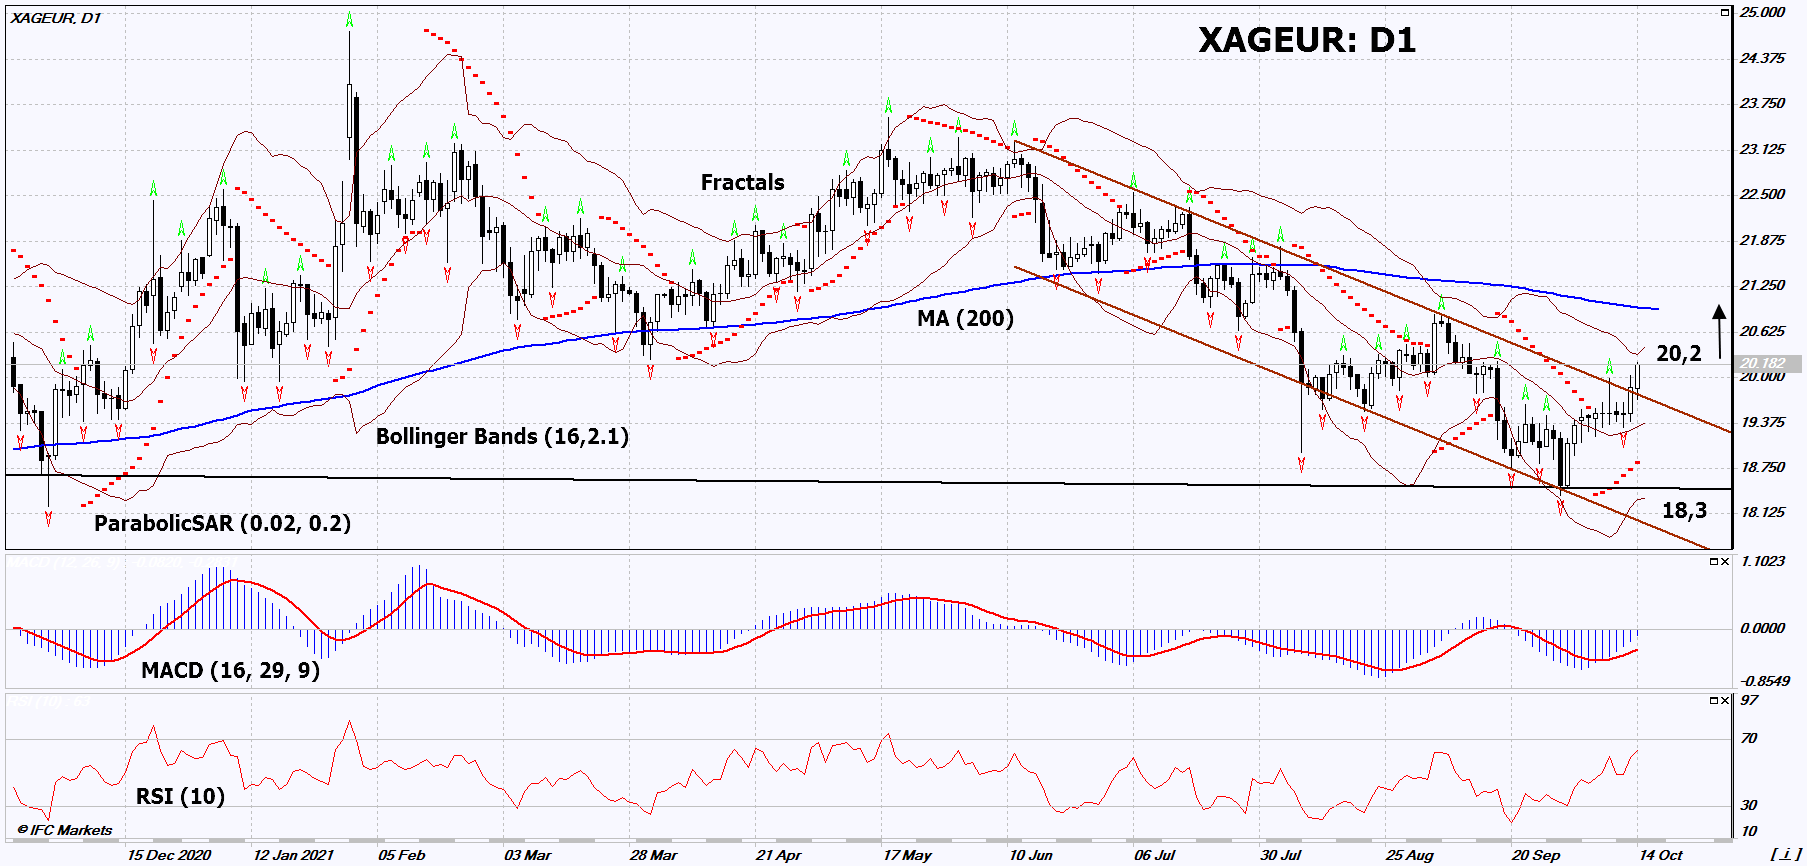
白銀对歐元 技术分析总结
高于 20.2
Buy Stop
低于 18.3
Stop Loss
| 指标 | 信号 |
| RSI | 中和 |
| MACD | 买进 |
| MA(200) | 中和 |
| Fractals | 买进 |
| Parabolic SAR | 买进 |
| Bollinger Bands | 中和 |
白銀对歐元 图表分析
白銀对歐元 技术分析
On the daily timeframe, XAGEUR: D1 went up from the descending channel. A number of technical analysis indicators have generated signals for further growth. We do not rule out a bullish movement if XAGEUR rises above the last high: 20.2. This level can be used as an entry point. The initial risk limitation is possible below the Parabolic signal, the lower Bollinger band and the last two lower fractals: 18.3. After opening a pending order, move the stop to the next fractal low following the Bollinger and Parabolic signals. Thus, we change the potential profit/loss ratio in our favor. The most cautious traders, after making a deal, can go to the four-hour chart and set a stop-loss, moving it in the direction of movement. If the price overcomes the stop level (18.3) without activating the order (20.2), it is recommended to delete the order: there are internal changes in the market that were not taken into account.
贵金属 基本面分析 - 白銀对歐元
Rising inflation in the US is helping to boost demand for precious metals. Will the XAGEUR quotes continue to rise?
In September this year, US inflation accelerated again to 5.4% in annual terms, which is a 13-year high. The same indicator was observed in June and July, and in August inflation fell to 5.3%. As we can see, the slowdown in the growth of the consumer price index has not yet become a trend. The Producer Price Index also rose to a 13-year high in September at 8.6% in annual terms. Despite this, the yield of the U.S. 10-Year Bond in 3 days decreased to 1.52% per annum from 1.63%. All this weakened the American currency and raised the quotes of precious metals. An additional factor in increasing demand for silver may be its use in industry and in alternative energy. In particular, silver is used in the manufacture of batteries, solar panels and electric vehicles.
附注:
本文针对宣传和教育, 是免费读物. 文中所包含的信息来自于公共渠道. 不保障信息的完整性和准确性. 部分文章不会更新. 所有的信息, 包括观点, 指数, 图表等等仅用于介绍, 不能用于财务意见和建议. 所有的文字以及图表不能作为交易的建议. IFC Markets及员工在任何情况下不会对读者在阅读文章中或之后采取的行为负责.


