- 分析
- 技术分析
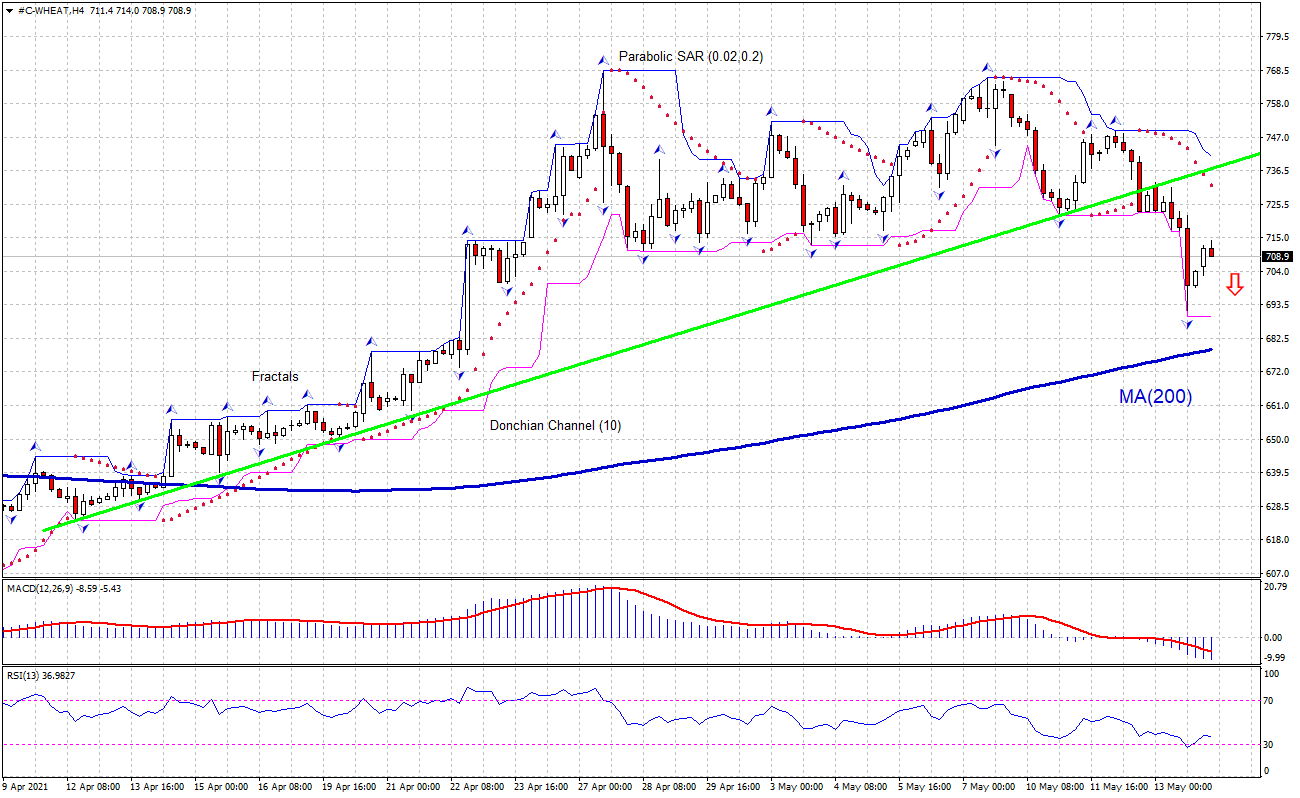
小麦 技术分析 - 小麦 交易: 2021-05-14
小麦 技术分析总结
低于 689.8
Sell Stop
高于 732.6
Stop Loss
| 指标 | 信号 |
| RSI | 中和 |
| MACD | 卖出 |
| Donchian Channel | 卖出 |
| MA(200) | 买进 |
| Fractals | 中和 |
| Parabolic SAR | 卖出 |
小麦 图表分析
小麦 技术分析
The #C-WHEAT technical analysis of the price chart in 4-hour timeframe shows the #C-WHEAT,H4 is falling toward the 200-period moving average MA(200) which is rising still. We believe the bearish momentum will continue as the price breaches below the lower Donchian boundary at 689.8. A pending order to sell can be placed below that level. The stop loss can be placed above 732.6. After placing the order, the stop loss is to be moved every day to the next fractal high, following Parabolic signals. Thus, we are changing the expected profit/loss ratio to the breakeven point. If the price meets the stop loss level without reaching the order, we recommend cancelling the order: the market has undergone internal changes which were not taken into account.
商品 基本面分析 - 小麦
Wheat price decline continues despite lower US ending stock forecast in May WASDE. Will the wheat price continue declining?
The May 2021 World Agricultural Supply and Demand Estimates (WASDE) report indicated smaller supplies, higher US domestic use, lower exports and reduced stocks for 2021/22 marketing year. Domestic use is expected to rise 6% due to higher feed, residual and food use. The annual feed and residual use is projected at 170 million bushels – the highest level in eight years, food use is forecast to rise another 3 million bushels to 963 million bushels . And wheat ending stocks are expected to decline 11% to 774 million bushels, a seven-year low. All these estimates mean higher demand which is bullish for price. However the technical setup is bearish for wheat and price is under pressure from technical selling.
附注:
本文针对宣传和教育, 是免费读物. 文中所包含的信息来自于公共渠道. 不保障信息的完整性和准确性. 部分文章不会更新. 所有的信息, 包括观点, 指数, 图表等等仅用于介绍, 不能用于财务意见和建议. 所有的文字以及图表不能作为交易的建议. IFC Markets及员工在任何情况下不会对读者在阅读文章中或之后采取的行为负责.


