- 分析
- 技术分析
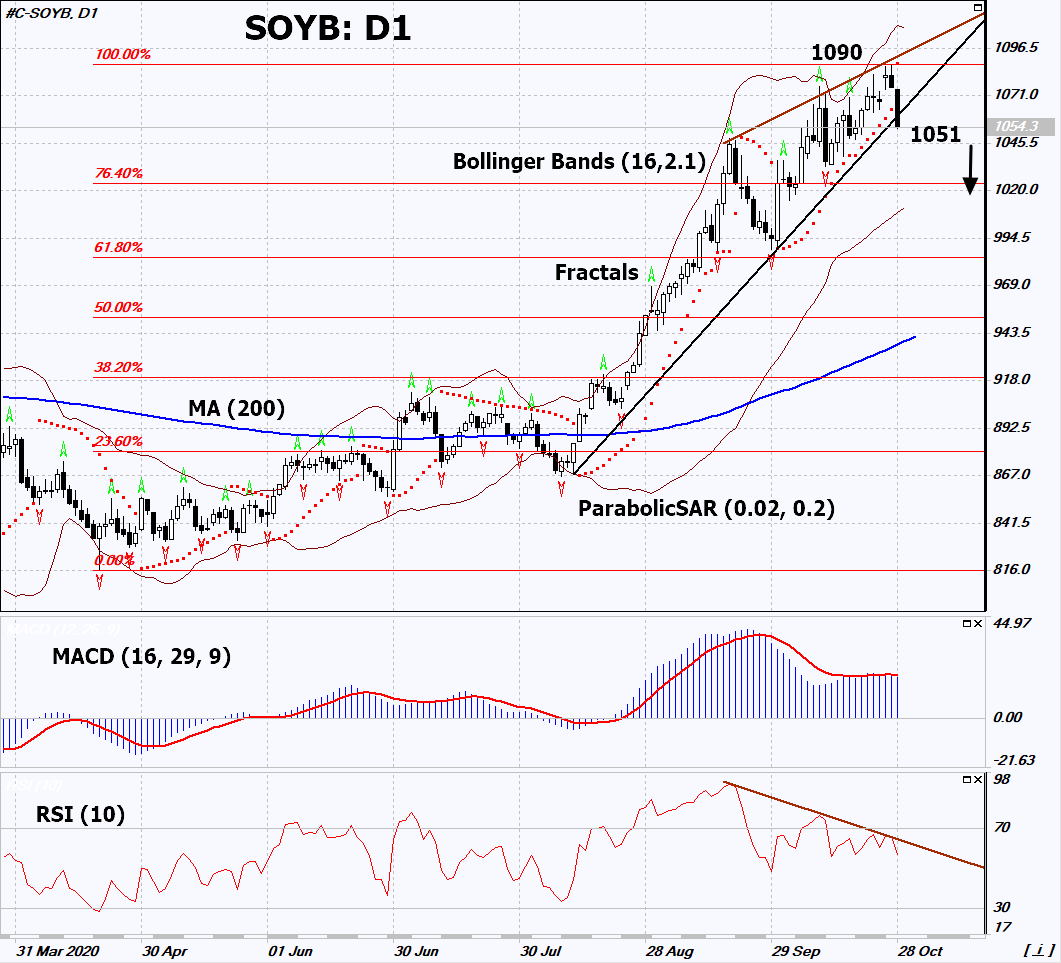
大豆 技术分析 - 大豆 交易: 2020-10-29
大豆 技术分析总结
低于 1051
Sell Stop
高于 1090
Stop Loss
| 指标 | 信号 |
| RSI | 卖出 |
| MACD | 卖出 |
| MA(200) | 中和 |
| Fractals | 中和 |
| Parabolic SAR | 卖出 |
| Bollinger Bands | 中和 |
大豆 图表分析
大豆 技术分析
On the daily timeframe, SOYB: D1 is correcting down from the maximum since July 2016. It broke down the uptrend support line. A number of technical analysis indicators formed signals for further decline. We do not rule out a bearish movement if SOYB falls below its last low: 1051. This level can be used as an entry point. We can place a stop loss above the maximum since July 2016 and the Parabolic signal: 1090. After opening a pending order, we can move the stop loss following the Bollinger and Parabolic signals to the next fractal maximum. Thus, we change the potential profit/loss ratio in our favor. After the transaction, the most risk-averse traders can switch to the 4-hour chart and set a stop loss, moving it in the direction of the bias. If the price meets the stop loss (1090) without activating the order (1051), it is recommended to delete the order: the market sustains internal changes that have not been taken into account.
商品 基本面分析 - 大豆
France and Germany have introduced quarantine due to the 2nd wave of Covid-19. Will the soybean quotations continue to decline?
It is unlikely that food consumption will decrease because of the 2nd wave of the coronavirus pandemic. Yet yesterday, the prices of almost all grain futures dropped markedly. France and Germany have introduced quarantine. Investors fear that other countries will follow suit. This could hurt shipping and export of US grain and soybean, which led to lower prices. The rains in Brazil after the drought were an additional negative factor for soya. This may increase the yield.
附注:
本文针对宣传和教育, 是免费读物. 文中所包含的信息来自于公共渠道. 不保障信息的完整性和准确性. 部分文章不会更新. 所有的信息, 包括观点, 指数, 图表等等仅用于介绍, 不能用于财务意见和建议. 所有的文字以及图表不能作为交易的建议. IFC Markets及员工在任何情况下不会对读者在阅读文章中或之后采取的行为负责.


